It's definetly my favourite DataViz tool ever.
But after a while, when you begin to elevate your game, you may find some difficulties if you don't spend some time understanding how Tableau works, even with simple tasks.
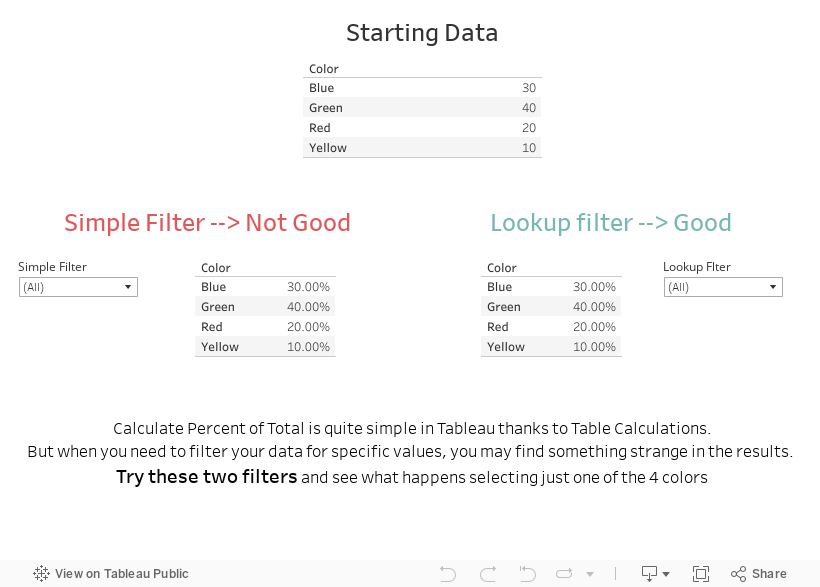
I remember my first impasse when I had to calculate percent of total while filtering the same dimension, with a sample data like this:
Color Value
Blue 30
Red 20
Green 40
Yellow 10
After having added Table Calculation on Value using "Percent of Total" I simply added Color on the filter shelf and selecting Green I thought I would have got 40%.
Surprisngly (for me back then, not now), I got 100%.
Why? I couldn't undesrtand how it could happen.
So I started spending some time studying Tableau and I realized of it works in terms of order of operations.

Since Percent of Total is a Table Calculation, it is executed after dimension filters (eg: selecting one of the 4 colors).
So my table calculation was working on pre-filtered data with just a color selected and 100% value was correct (40 out of 40).
To by-pass this, you just need to create a Calculated Field using a Table Calculation based on the dimension you want to filter.
With this little trick, your filter will be executed after the Percent of Total Calculus and selecting Green you'll get the 40% I was looking for back then.

If you don't trust my words (you erethic!), take a look at this simple dashboard I realized just for you.
At the end of the day, my suggestion is to study how Tableau works from the early beginning because you will save time doing you vizzes and you'll understand how powerful it could be.
