mercoledì 31 ottobre 2018

Density chart and transparent background in Tableau 2018.3

Finally Tableau 2018.3 is here and I couldn't be happier.

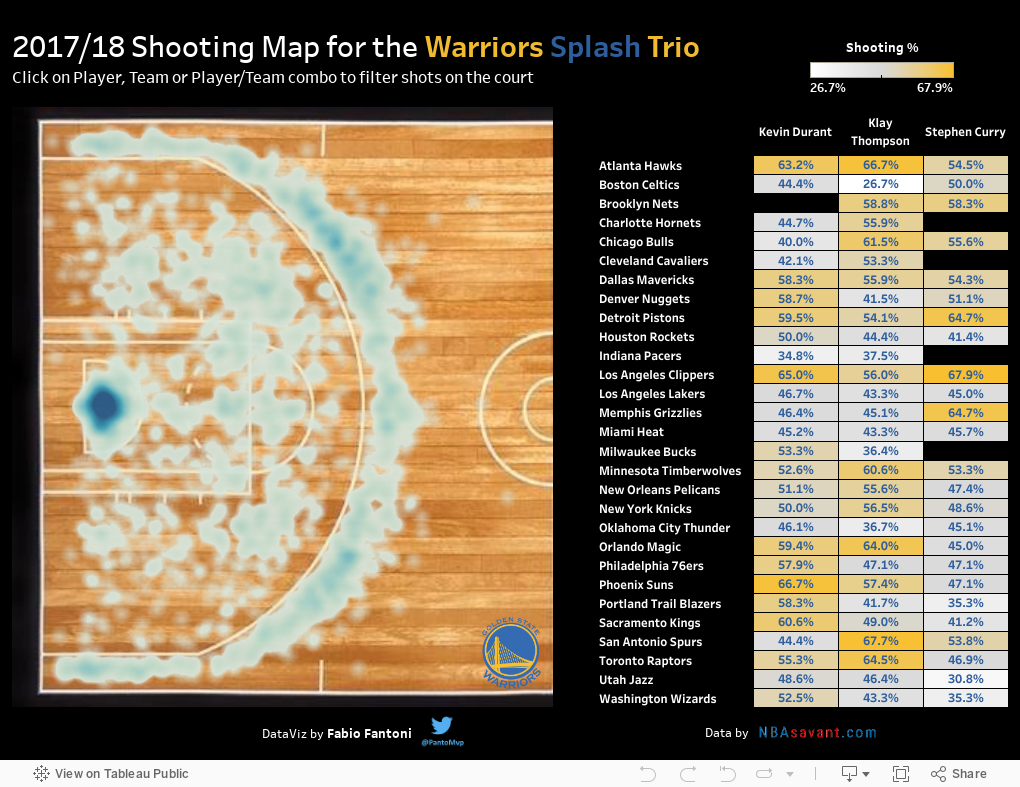
There are several new features but the ones I like the most are density chart and trasnsparent background.

Just after the announcement, yesterday I downloaded the new version of Tableau Public and in just 5 minutes I was able to test these new features.

In the dataviz I analyzed the 2017/18 shooting habits of the Golden State Warriors trio: Steph Curry, Klay Thompson and Kevin Durant.

You can interact with data clicking on player, opponent team or player/team combo to filter just the specified portion of data.


mercoledì 10 ottobre 2018

2016 MLB Hume Runs

It's quite a long time since my last post, but I had this idea in mind about the Arc Chart.

So due to my passion for Tableau I did some homework in order to understand how to create this type of chart and thinking about arches the first scenario that came to my mind was baseball.

After having found a dataset showing all the Home Runs for the 2016 MLB season, I decided to visualize the hit distance in profile combined with apex and from above combined with speed.

Clicking on the top hitters name will trigger an higlight to better visualize those players' Home runs among the others.

lunedì 26 febbraio 2018

Emeka Okafor solid addition for the Pelicans

domenica 5 novembre 2017

Gallinari & Clippers dimension

martedì 24 ottobre 2017

NBA Offensive/Defensive Rating Comparison (October 2017 1st NBA week)

domenica 22 ottobre 2017

A Head Full of Dreams

Makover Monday Week 43 - Myers Briggs Type